Did you ever want to use Swift to draw simple graphs and charts in your iOS app without using some 3rd party library? Also you did not want to reinvent the wheel with CoreGraphics? I thought that was not possible until I found out about a really nice open source SDK owned by Apple that you can use for that.
Here comes CareKit! https://developer.apple.com/documentation/carekit
Are you looking for how to draw graphs in SwiftUI? Check my other blog post: https://mic.st/blog/draw-line-graphs-in-swiftui/
A (very) short introduction to CareKit
CareKit is an open source SDK by Apple that was intended for the use in health management apps. Of course, you do not have to develop a health management app to use it. You can use it for just anything ☀️! One cool thing about the SDK: The owners of the repository splitted it up into several packages so you if you just want to draw nice looking user interfaces with the SDK you do not need to import the whole thing 👍.
I played around with the graph drawing functionality recently which I want to present to you in this quick overview. I really like it because firstly it is looking nice and secondly it is really easy to use. The following image shows a line graph you can draw pretty quickly with some self explanatory methods.
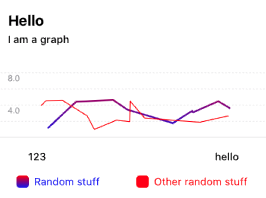
You basically just throw in an array of points and the OCKGraphView does all the heavy lifting for you. You can give your graphs colors (and gradients 🌈!), animations and labels and you can change the type of graph (line, bar, scatterplot) with a keystroke. So what else do you want? This is great stuff 🥳
Get the dependencies
If you install XCode you cannot instantly use CareKit because it is not delivered with XCode. Thanks to Swift Package Manager you can easily add the git repository to add it to your project.
The official git repo for CareKit is: https://github.com/carekit-apple/CareKit To add it to your project via Swift PM, just click in your open project on File-> Swift Packages -> Add Package Dependency and copy the link above inside the input field.
The repository owners splitted up CareKit into several packages. So if you just want to use the graphs, you just need to import CareKitUI.
For drawing a graph you can use OCKCartesianChartView that draws the graph on a card like element and gives you also a some views around the actual graph (e.g. a contentStackView, labels and a header).
Let’s draw some graphs in Swift!
Let’s draw two line graphs with random data and some colors:
let chart = OCKCartesianChartView(type: .line)

private func setupChart() {
    /// First create an array of CGPoints that you will use to generate your data series.
    /// We use the handy map method to generate some random points.
    let dataPoints = Array(0...20).map { _ in CGPoint(x: CGFloat.random(in: 0...20),
                                                      y: CGFloat.random(in: 1...5)) }

    /// Now you create an instance of `OCKDataSeries` from your array of points, give it a title and a color. The title is used for the label below the graph (just like in Microsoft Excel)
    var data = OCKDataSeries(dataPoints: dataPoints,
                             title: "Random stuff",
                             color: .green)

    /// You can create as many data series as you like 🌈
    let dataPoints2 = Array(0...20).map { _ in CGPoint(x: CGFloat.random(in: 0...20),
                                                       y: CGFloat.random(in: 1...5)) }
    var data2 = OCKDataSeries(dataPoints: dataPoints2,
                              title: "Other random stuff",
                              color: .red)

    /// Set the pen size for the data series...
    data.size = 2
    data2.size = 1

    /// ... and gradients if you like.
    /// Gradients and colors will be used for the graph as well as the color indicator of your label that shows the title of your data series.
    data.gradientStartColor = .blue
    data.gradientEndColor = .red

    /// Finally you add the prepared data series to your graph view.
    chart.graphView.dataSeries = [data, data2]

    /// If you do not specify the minimum and maximum of your graph, `OCKCartesianGraphView` will take care of the right scaling.
    /// This can be helpful if you do not know the range of your values but it makes it more difficult to animate the graphs.
    chart.graphView.yMinimum = 0
    chart.graphView.yMaximum = 6
    chart.graphView.xMinimum = 0
    chart.graphView.xMaximum = 10

    /// You can also set an array of strings to set custom labels on the x-axis.
    /// I am not sure if that works on the y-axis as well.
    chart.graphView.horizontalAxisMarkers = ["123", "hello"]

    /// With theses properties you can set a title and a subtitle for your graph.
    chart.headerView.titleLabel.text = "Hello"
    chart.headerView.detailLabel.text = "I am a graph"
  }Code language: Swift (swift)
The SDK animates your graphs automatically if you add new data to the OCKCartesianGraphView. You do not even have to wrap your code into UIView.animate() blocks. Let’s see an example:
If you set chart.graphView.dataSeries = [data, data2] on a OCKCartesianGraphView that is already presented in your view hierarchy, everything gets animated automatically 😃
Final thoughts on drawing graphs or charts in Swift
I think this is a really nice API if you want to quickly show some data. Whenever I wanted to draw some graphs or charts with Swift before, I used Core Graphics for that. However, if you go down that rabbit hole you have to rebuilt a lot of stuff that is already there when using the OCKCartesianGraphView. I am very curious about using it in some of my current projects. For example, I could think about using it in my vocabulary app for visualizing learner’s progress.